The guide · written from a real, measured fast
The Stages of a Water Fast. The Real Timeline, Hour by Hour and Day by Day
Search the stages of a water fast and you get the same chart on forty different sites. Tidy hour blocks, confident labels, a curve that always goes the right way. Almost none of them were written by somebody who dipped a strip that morning.
This one is. John, 56, started a doctor supervised 90 day water fast on August 1, 2026 at 228.6 pounds. He weighs in on the same bathroom scale every morning, dips a keto mojo urine strip every morning and photographs both. Everything below is laid over those mornings.
The stages are four different clocks, not one
Here is the thing every stage chart gets wrong. It draws one line. There are four. They do not move together.
- The fuel clock. What the body is burning. Stored carbohydrate first and then fat.
- The scale clock. What the morning number does. It is loudest at the start and it is mostly water then.
- The feeling clock. Energy, hunger, mood. This one does not track the other three at all.
- The instrument clock. What a home ketone strip can actually see. This one runs latest of all.
On John’s fast the scale did its biggest work while the strip was still blank. His energy came back on the same morning his strip first showed a trace. His worst day arrived after two days that felt fine. Read the stages as four clocks and the whole thing stops being confusing.
The whole timeline in one sentence. The first 48 hours are water leaving, hours 48 to 72 are the switch and the hard part. Everything after day 4 is a slow steady middle that no chart makes look interesting.
The hour by hour timeline, from a fast that was actually measured
- HOUR 0 · 228.6 LBThe last meal is still in you
Nothing is happening yet. The body finishes digesting and then leans on glycogen, the carbohydrate stored in the liver and muscles. Energy is normal. Hunger shows up at your usual meal times because your body expects food then. This part is a habit problem more than a fuel problem. John's day 1 line was simply that the scale said 228.6 and the deal with his doctor is that if the labs say stop, he stops.
- HOUR 12 TO 24 · 224.2 LBGlycogen drains and the scale drops hard
Every gram of glycogen is stored with roughly three grams of water and the two leave together. That is the entire explanation for the number on the second morning. John woke up 4.4 pounds lighter. His own words were that there is a low hum of hunger in the background but nothing he has not sat through before. Ketone strip blank.
- HOUR 24 TO 48 · 220.6 LBThe switch starts and you cannot feel it yet
With glycogen mostly spent, the body pulls fat out of storage and the liver starts making ketones. The scale gave up another 3.6 pounds for a total of 8.0. Hunger arrives in waves rather than a rising line. Headaches and lightheadedness turn up for a lot of people in here, which is the fluid and sodium side of a water fast more than the food side. Strip still blank.
- HOUR 48 TO 72The hard stretch. The one nobody warns you about
This was John's worst day of the whole first week. Sluggish, low on energy, a little anxious, his body stressed and he could feel it. The strange part in his own telling is that he was not hungry. He described a battle between a body that wanted the cookies, the pizzas, the burgers and a mind that knew he was not doing that. Anyone stopping at 48 hours walks away right before this. His day 3 note is here.
- HOUR 72 · 218.0 LB · STRIP 5The turn
The morning everything changed direction at once. Down another 2.6 pounds for 10.6 total. His words were that the wall from yesterday did not follow him into today, that the edge came off and he honestly had more energy than the day before. The urine strip showed its first trace, a 5 on the bottle chart. Three mornings of blank. Then this.
- HOUR 96 · 216.0 LB · STRIP 8Ketosis, out loud
Down 12.6 total. The strip showed a clear reading rather than a trace and this is the morning John called himself officially in ketosis. Same morning his baseline blood panel landed, with the fasting glucose of 106 that is the reason this whole project exists. Every value is on the bloodwork page.
- HOUR 144 · 212.5 LBOne week of hours
16.1 pounds gone. His report was energy, feeling good and something people do not expect. His appetite was gone. Not suppressed, gone. What replaced it was a nose that noticed everything, which turns into its own problem later.
- HOUR 168 · 211.4 LB · STRIP 16The strip pegs
The morning of day 8 the strip finally hit the darkest square on the chart, a full week after the fast began. Same morning he warned everyone he was getting cranky, said it was normal for him and that it would continue. Peak instrument reading and a rough mood, on the same morning. Four clocks.
The stages after the hours run out
Past the first week the useful unit stops being hours. Here is every stage John has actually crossed, on the same scale, every morning.
| Stage | Morning | Weight | Down from start | Strip | What marked it |
|---|---|---|---|---|---|
| Glycogen | Day 2 hour 24 | 224.2 lb | −4.4 | 0 | Biggest single night of the whole fast |
| The switch | Day 3 hour 48 | 220.6 lb | −8.0 | 0 | The hard day starts here |
| The turn | Day 4 hour 72 | 218.0 lb | −10.6 | 5 | Energy back, first trace on the strip |
| Ketosis | Day 5 hour 96 | 216.0 lb | −12.6 | 8 | Called officially in ketosis |
| Appetite gone | Day 7 hour 144 | 212.5 lb | −16.1 | 8 | Not hungry, very sensitive to smells |
| Strip pegged | Day 8 hour 168 | 211.4 lb | −17.2 | 16 | Top of the chart and cranky |
| Steady middle | Day 14 | 205.0 lb | −23.6 | 16 | Two weeks, about half a pound a morning |
| Under 200 | Day 20 | 199.7 lb | −28.9 | 16 | First time under 200 in years |
| Out of obese | Day 23 | 197.0 lb | −31.6 | 16 | BMI 34.6 at the start, 29.9 that morning |
| The plateau | Day 29 | 191.1 lb | −37.5 | 16 | Scale did not move at all |
| Broth day | Day 30 | 190.2 lb | −38.4 | 16 | A third of the way and the first food |
| The reset | Day 32 | 192.6 lb | −36.0 | 0 | Up 2.4 in two mornings, strip back to blank |
| Back on track | Day 39 | 184.9 lb | −43.7 | 16 | Strip at the top again nine mornings later |
SWIPE THE TABLE SIDEWAYS FOR ALL COLUMNS →
All weights are first thing in the morning on the same bathroom scale. The strip number is a keto mojo urine strip matched against the chart on the bottle, where 0 is blank and 16 is the darkest square.
Stage one, hours 0 to 24. Water in a costume
Be honest with yourself about that first number. Glycogen is stored with roughly three grams of water per gram of carbohydrate. Burn through it and the water goes out with it, which is why the scale falls faster in these hours than it ever will again. John said it on camera on his own day 2, before anyone could accuse him of hiding it. The published reviews of prolonged fasting describe the same shape, a steep early drop that settles into a slower steady loss.
The proof is in his own record further down. First night 4.4 pounds. Second night 3.6. By week 4 the mornings were running under a pound and one of them went the other way entirely. Nobody keeps losing four pounds a night.
Stage two, hours 24 to 72. The switch and the day it costs you
This is the stage that decides whether people finish. The body is moving off easy sugar and onto stored fat. That transition has a bill.
John paid his on day 3. Not hunger. Sluggishness, low energy, mild anxiety and a stressed body he could feel. Plenty of people quit right here and tell themselves fasting does not agree with them, when what actually happened is that they stopped one morning short.
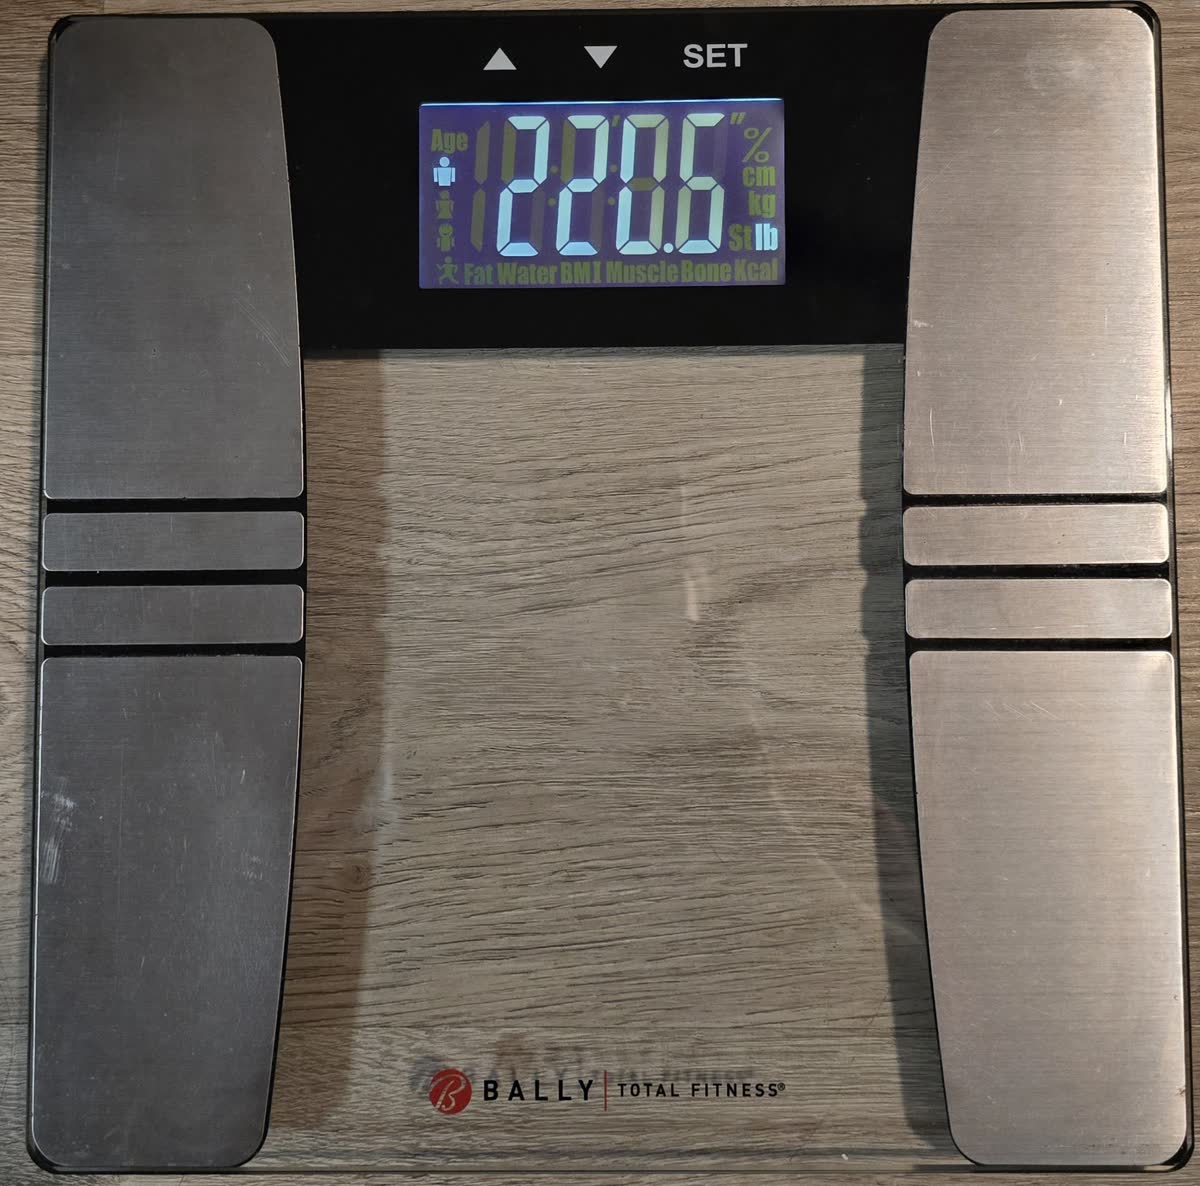
Eight pounds gone and the hard day about to start.
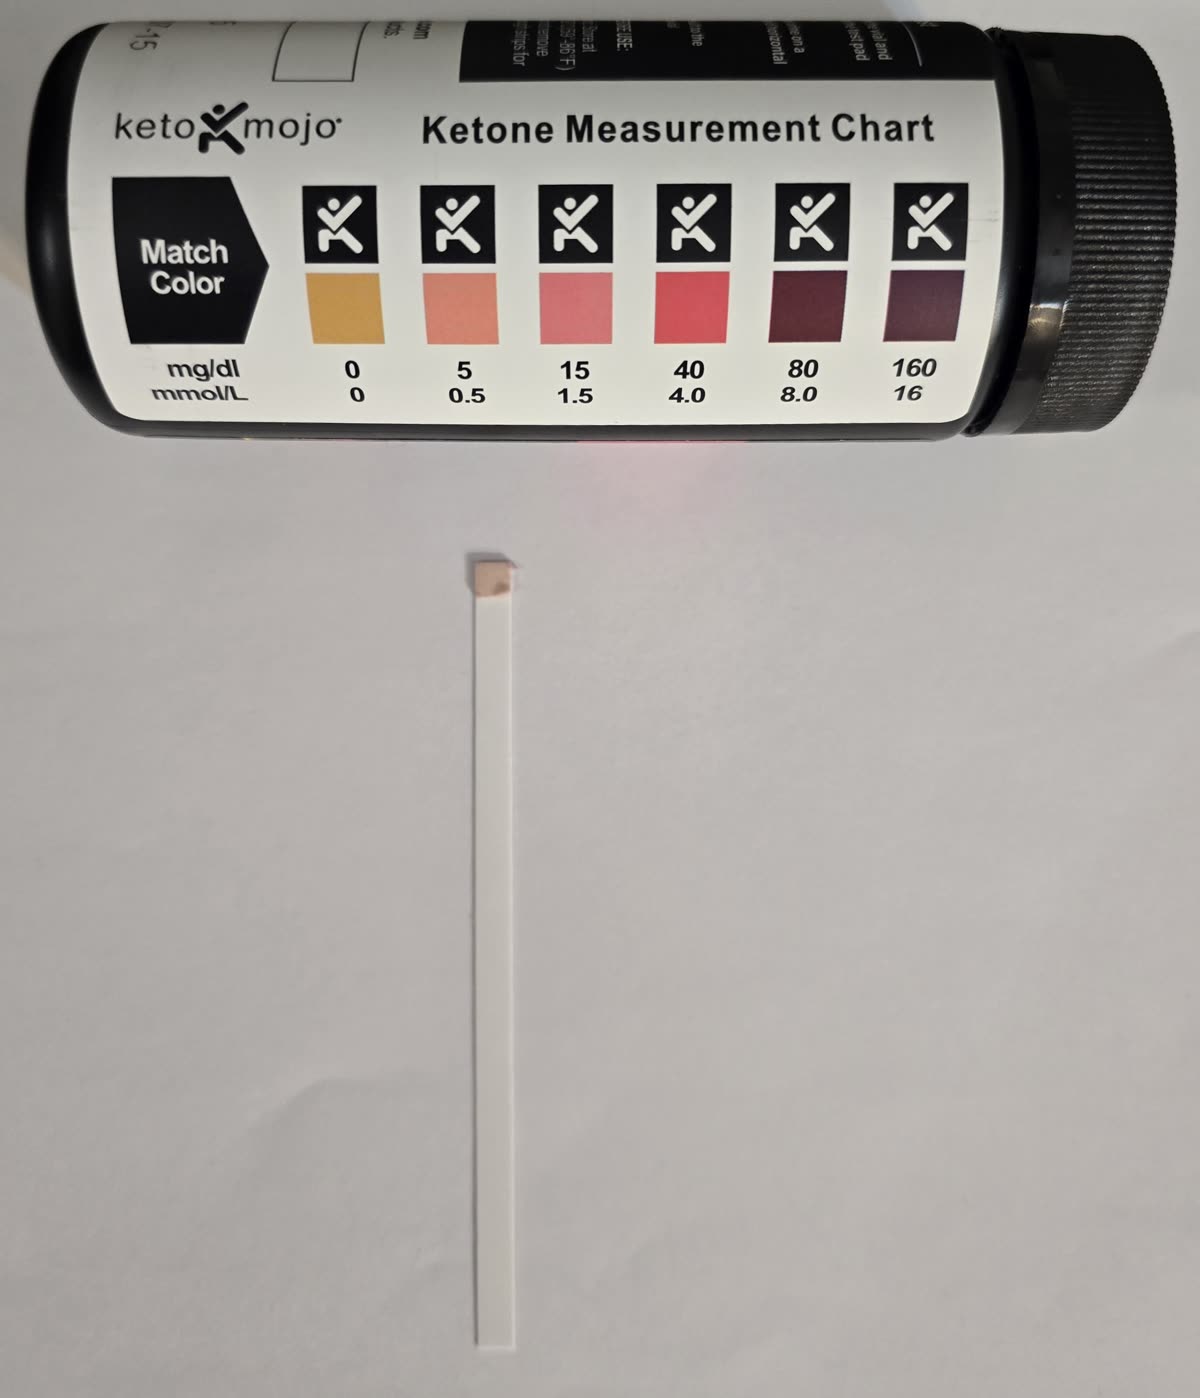
The first trace, one morning later.
Hunger in this stage is worth understanding on its own. It does not climb in a straight line. It arrives, peaks and leaves, which is what the hunger hormone literature describes and what John reports living. His clearest version of it came on day 10, when he got busy and forgot to drink water and the hunger really set in during the evening. His fix was to sit down, calm down and ride the wave. Once the wave passed he was not hungry anymore.
Stage three, day 4 to day 8. Ketosis arrives before the instrument does
Two different things happen here and people mash them into one. The body switched fuel around hour 72. The strip agreed on its own schedule.
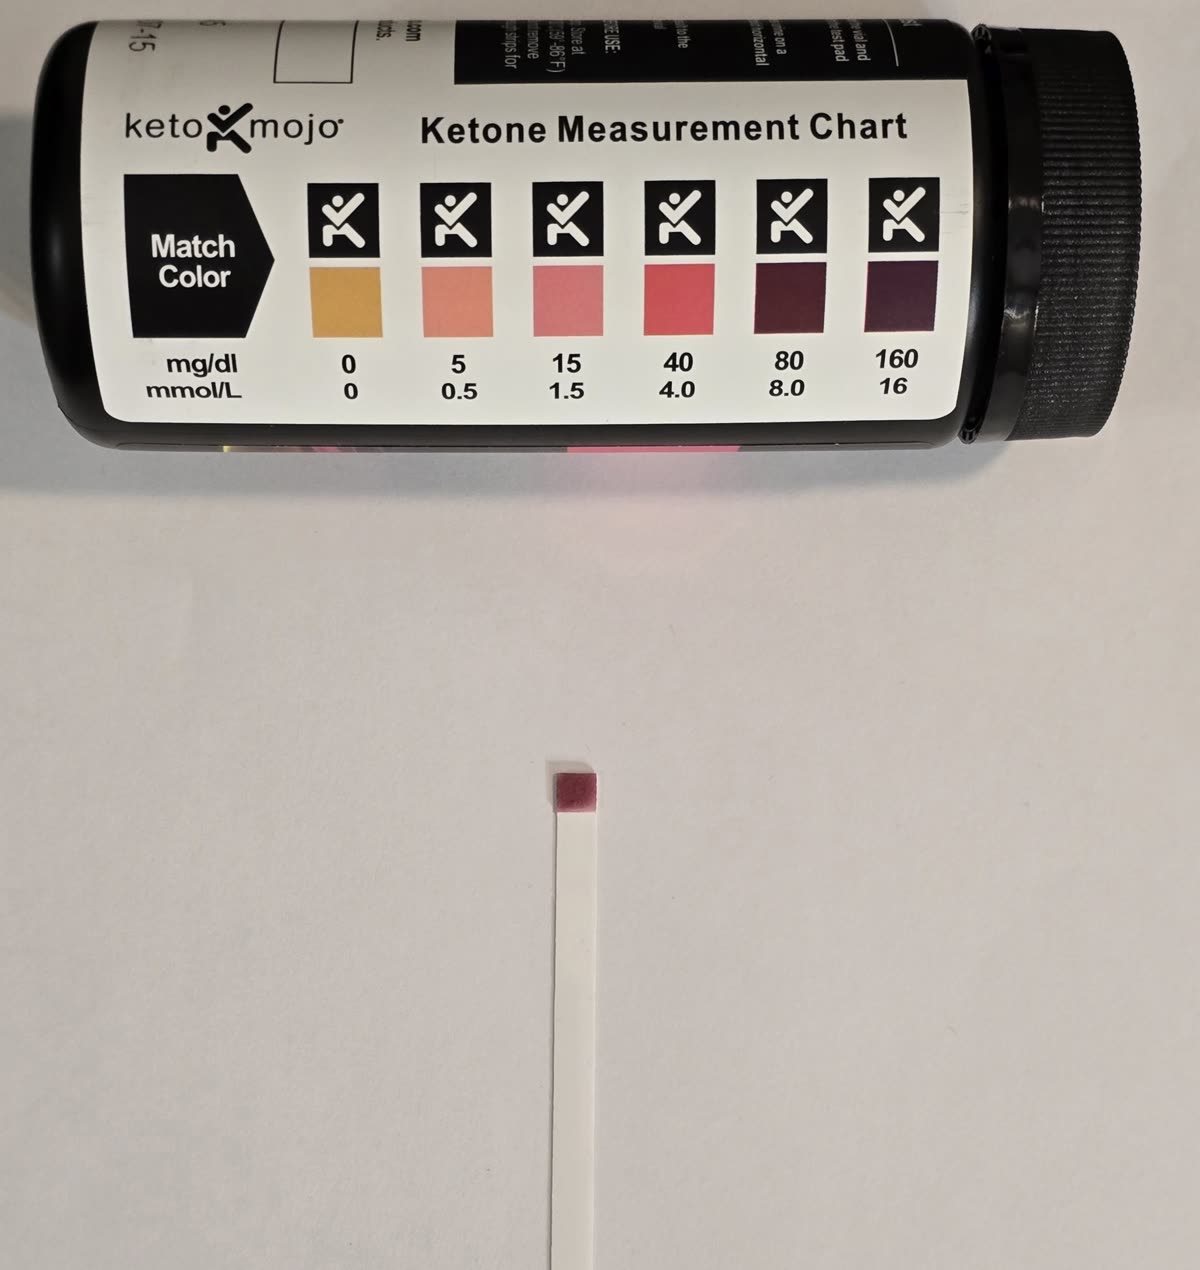
A clear reading. Officially in ketosis.
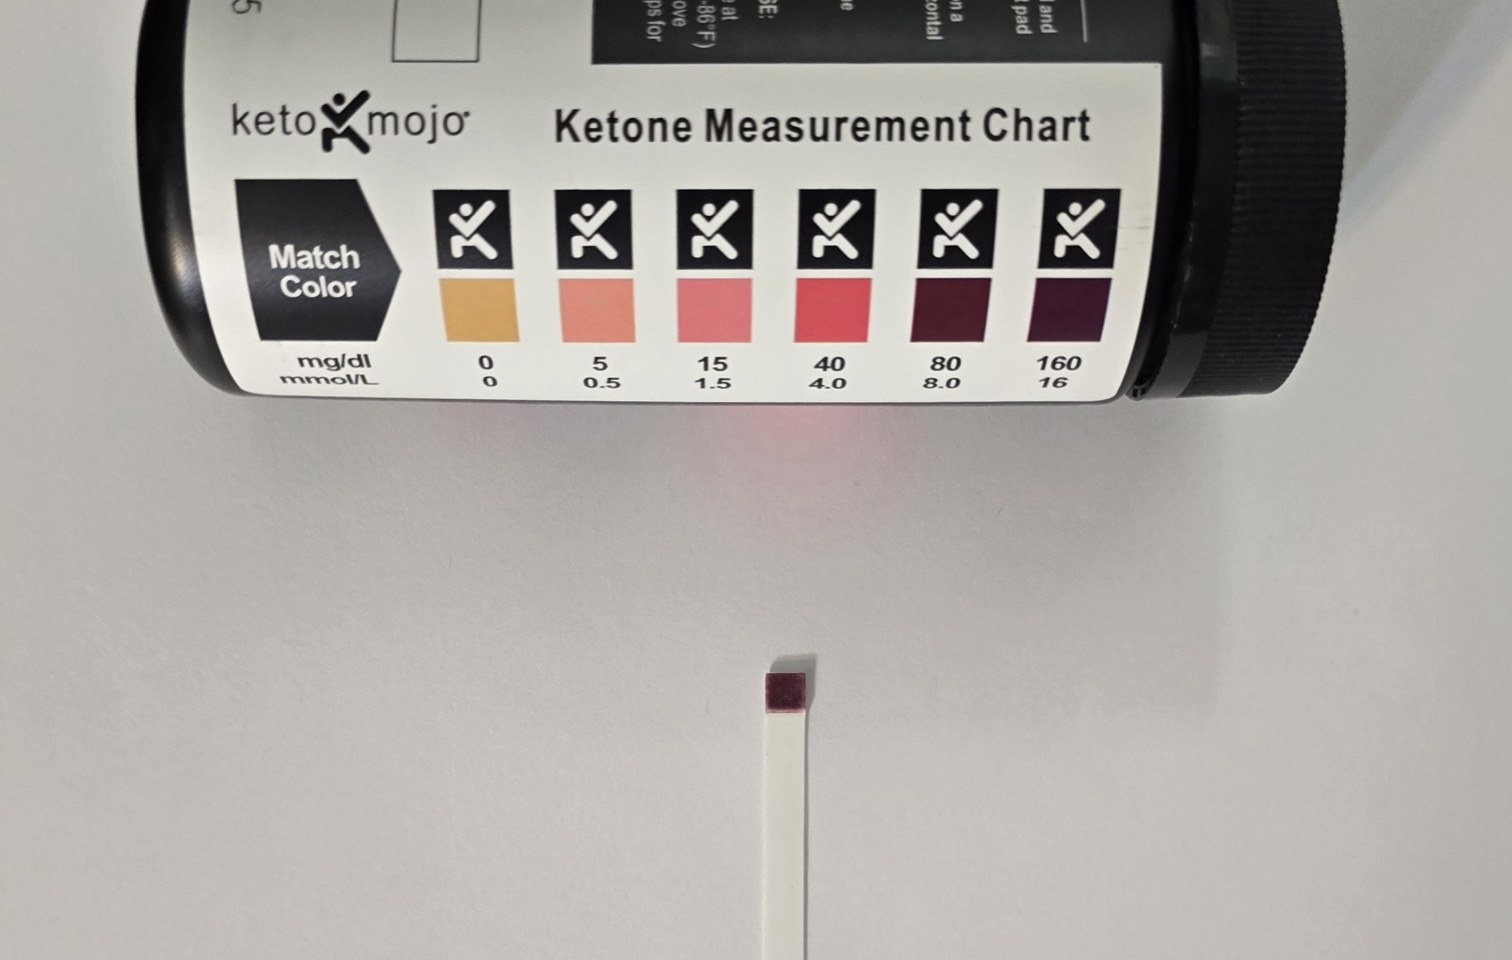
The morning his strip first read 16, a full week in.
Urine strips measure what a body spills rather than what it makes. They lag behind. A blank strip in the first three days is bad instrumentation, not a failed fast. If you are on day 2 staring at a blank strip and wondering what you did wrong, the answer is nothing. John’s did the same thing.
What arrives with this stage is the part people fast for. Energy back at hour 72. A clear strip reading at hour 96. Appetite gone by day 7. Every one of those is a reported feeling except the strip, which is a photograph.
Stage four, week 2 onward. The boring middle that does all the work
Nobody makes a chart of this stage because there is nothing dramatic in it. John’s own framing on day 10 was that from here forward he expected about half a pound to a pound a day. That is roughly what happened.
- Day 14. 205.0 pounds. Two full weeks. His word for how he felt was amazing.
- Day 20. 199.7 pounds. Under 200 for the first time in a long time. He named 160 as the real target.
- Day 23. 197.0 pounds. BMI 29.9, which moved him out of the obese classification he started in at 34.6.
- Day 29. 191.1 pounds. The scale did not move at all. It happens and it is not a failure.
- Day 34. Waist down from about 40 inches to a comfortable 36. His ring slides on and off. His shoes fit again.
The tape measure is the useful instrument in this stage, not the scale. Day 34 and day 39 are both about inches rather than pounds. On day 39 he described going from an extra large shirt down to a tight large, with the top and the bottom of his body shrinking at different rates, which he called the shape of a pear.
His home scale also estimates body fat and it read 42.3 percent on day 1 and 30.3 on day 39. Take that direction seriously and the decimals lightly. A home impedance scale reads through body water and body water moves a lot on a fast.
The stage no chart draws. What happens when food comes back
Every stages chart ends at the fast. The most useful stage on this whole page is the one after it.
Day 30 was the checkpoint. 190.2 pounds, down 38.4, strip at the top of the chart. John cooked a small vegetable broth and ate it with a quarter of an avocado.

One small bowl and a quarter of an avocado.
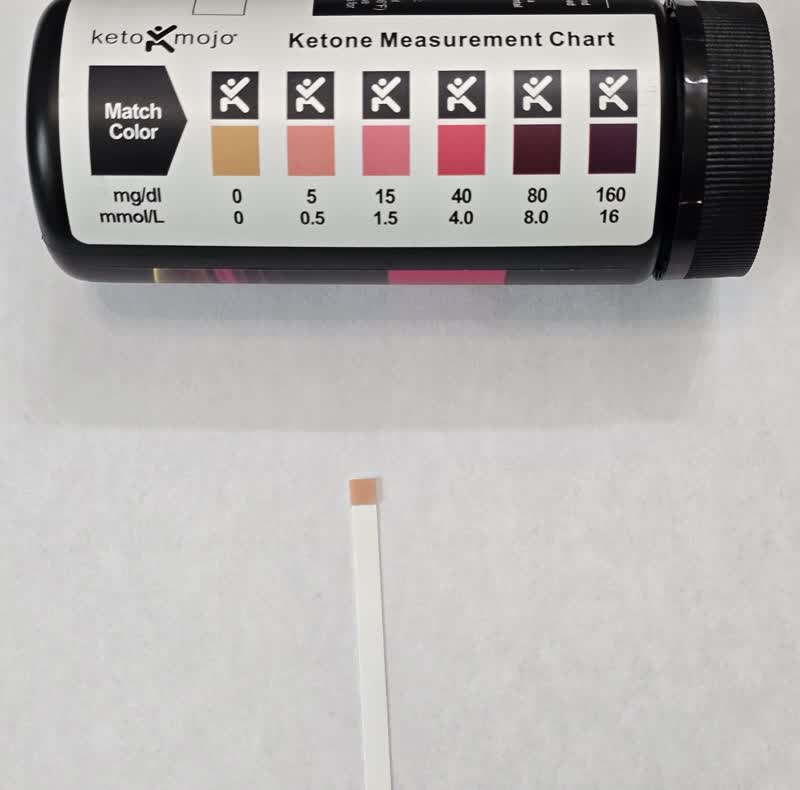
Blank. Two mornings after the broth.
The next morning the scale read 192.0, up 1.8. The morning after that, 192.6. That is 2.4 pounds back in two mornings from one small bowl of food. The strip fell from 16 to 4 to blank and stayed blank on day 33, day 34 and day 35. It did not read 16 again until the morning of day 39, nine mornings after the broth.
A quarter of an avocado is not free. John, day 32, two mornings after breaking 30 days of water with a small broth and a quarter of an avocado.
His own read on the rebound was that it was mostly water rather than fat. The scale supports him. He was back under the day 30 number within a week and at 184.9 on day 39. But anyone planning a fast should look hard at this stage before they look at any of the earlier ones. It is the one that decides whether the number stays.
What no stage chart can honestly tell you
The autophagy timelines are the biggest problem in this entire category. You have seen them. Cellular cleanup starts at hour 16, peaks at hour 48, doubles at 72.
Autophagy is real. It is the cell recycling process behind the 2016 Nobel Prize in Physiology or Medicine. What is not real is any of those hour numbers as a measurement of you. Nobody fasting in their kitchen owns a tool that can confirm it. John talks about autophagy in his videos as something he believes is kicking in. That is exactly how it is reported here, as his belief rather than a reading.
The three things this site can actually show you are a scale, a strip and a blood panel. Everything on this page comes from one of those three. The full autophagy guide takes that argument apart properly.
Where this fast is right now
Day 39 of 90. 184.9 pounds, down 43.7 from 228.6, BMI 28, strip at the top of the chart. The next stages have not been lived yet. They are not written yet. That is the rule this whole site runs on.
Who should not do any of these stages
- Anyone pregnant or breastfeeding.
- Anyone with diabetes or on blood sugar medication.
- Anyone with a heart condition, kidney disease or a history of an eating disorder.
- Anyone under 18.
- Anyone on daily medication that assumes food.
John is 56 and does all of this under a doctor who has known him for years, with monthly bloodwork and stop authority. If she says eat, he eats. The warning signs he watches for are the ones every mainstream source lists. Severe dizziness, a racing or irregular heartbeat, fainting, vomiting, confusion. Any of those ends the fast and starts a phone call rather than a push through.
This site reports what one man does and measures. It does not tell you what to do.
If you want the stages at a specific length rather than all of them at once, the 24 and 48 hour guide covers the first two days, the 3 day guide covers the switch and the 7 day guide covers the first full week. Today’s number is always on the daily notes page.
Quick answers
What are the stages of a water fast in order?
Four of them, measured on this fast. Stage one runs hours 0 to 24 and burns liver glycogen, the stored carbohydrate, which takes its water with it. Stage two runs hours 24 to 72 and is the fuel switch, the roughest stretch for John. Stage three starts around hour 72 when the body is running on fat and the ketone strip finally shows something. Stage four is the long steady middle, roughly half a pound to a pound a morning. A fifth stage exists that no chart draws, which is what happens when food comes back.
How many hours until you are in ketosis on a water fast?
The body starts making ketones long before anything at home can see them. John dipped a urine strip every morning. It read blank at hour 24, blank at hour 48 and blank on the morning of day 3. The first trace appeared at hour 72 and he called himself officially in ketosis on the morning of day 5, at hour 96. It reached the darkest square on the bottle chart on the morning of day 8. Those are strip readings rather than blood readings. A urine strip lags behind what the body is actually doing.
What is the hardest stage of a water fast?
For John it was hours 48 to 72, the third day. His words were that he felt sluggish, low on energy and a little anxious, that his body was stressed and he could feel it. He also said he was not hungry during it, which surprised him. The battle he described was between his body wanting cookies and pizza and his mind knowing he was not doing that. The morning after, at hour 72, the edge came off and his energy was back.
How much weight do you lose at each stage of a water fast?
The first stage is the loudest and the least honest. John lost 4.4 pounds by hour 24 and 8.0 by hour 48, on the same bathroom scale each morning. Hour 72 brought the total to 10.6 and one week to 16.1. After that it settled. By his fourth week the mornings were running under a pound and on day 29 the scale did not move at all. Through day 39 he is down 43.7 pounds from 228.6 to 184.9.
Does autophagy start at a specific hour of a water fast?
Nobody at home can measure it. This page will not pretend the charts are measurements. Autophagy is a real cellular recycling process and the 2016 Nobel Prize in Physiology or Medicine went to the work that uncovered how it is controlled. The hour by hour autophagy timelines all over the internet are not something a person fasting in their kitchen can confirm with any tool they own. John talks about autophagy in his own videos as something he believes is happening. What this site can show you is the scale, the strip and the blood panels.
What stage of a water fast is day 30?
Deep in the steady middle, which is exactly why John used it as his checkpoint. He weighed 190.2 pounds on the morning of day 30, down 38.4 from his start, with his strip at the top of the chart. He also broke the water that day with a small vegetable broth and a quarter of an avocado. The scale answered with 192.0 the next morning and 192.6 the morning after that. The strip fell from 16 to 4 to blank. That is the stage no chart draws.